The reports you need to make data-driven decisions about your safety programs will adequately equip you to maintain a safe and healthy workforce. Use these best practices to stay on top of your evaluations and keep your safety procedures as effective as possible.

1. Configure Your Reports to Match Your Business
Configure the reports within your EHS software to align with both your business setup (think locations, departments, lines of business, etc.) and your existing safety processes.
2. Use a Healthy Mix of Reports
Using a mix of leading and lagging indicators will give you a holistic view of your safety procedures’ past, present, and future effectiveness.
3. Establish an Auditable Workflow
Leading and lagging indicators show you what has happened and what may happen. But another vital piece of the puzzle is answering the question, “What’s in process right now?”
Putting together an established and documented workflow will ensure that all required tasks get completed and nothing slips through the cracks.

A Data-Driven Guide to Improving Workplace Safety
Download this eBook to learn the different types of safety data and best practices for using data and analytics to improve your safety program.
Novara Helps Businesses Take a Data-Driven Approach to Safety
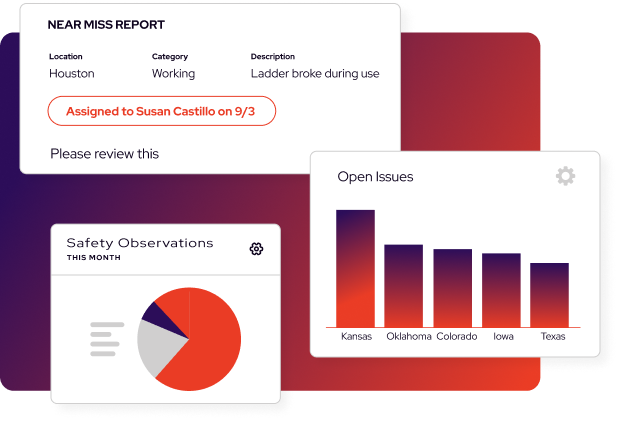
Novara simplifies data visualization and reporting, giving users easy access to actionable insights into their EHS program performance. Your data is presented in real-time, so no delay or extra steps are required to access the information. The dashboards are configured based on features tailored to your business’s unique requirements, giving you the power to make informed decisions that impact workplace safety.
Visualize EHS Program Data
With Novara EHS data and analytics, you can view metrics, top issues, and compliance percentages in a single view. Our data visualization allows you to capture metrics based on existing client application configurations (no out-of-the-box static reports) and drill down into detailed reports to see more granular underlying data. You can filter your Novara EHS data to quickly identify trends and risk indicators by location or group from training reports.
Generate Flexible Reports
Novara EHS allows you to export reporting data for use in spreadsheet applications or other reporting programs and quickly develop executive-level summaries and reports. Easily share reporting data to encourage all employees to stay committed to safety.
Improve Overall Safety Performance
Use the insights provided by Novara EHS reporting to implement ongoing safety program improvements with data-driven decision-making and a view into leading indicators where potential problems could arise. Our reporting features give you greater confidence that your EHS data is current and accurate.
Let Novara show you how to take a data-driven approach to safety.
Related Content
Explore more comprehensive articles, specialized guides, and insightful interviews selected, offering fresh insights, data-driven analysis, and expert perspectives.